support@dragon-dealz.ch
 +1 (888) 303-8337








Why Bother Forecasting an Amazon Launch?
Since most of the time the launches don’t fail because of a product failure but because of a planning failure. Whereby, sellers under-fund their ad spend, over-estimate traffic from organic sales, and run out of funds right when things are about to turn around.
When selling on Amazon, it forces you to ask yourself some very tough questions: How many people are really going to see this? How many of them will I buy? And how much will it cost to get enough of both to rank?
Step 1: Estimate Your Traffic
Traffic is everyone who lands on your listing organic search, PPC clicks, external traffic, everything combined.
Start with search volume. Look up your main keyword’s monthly search volume using a tool like Helium 10, Jungle Scout, or Amazon’s own Brand Analytics (if you qualify). This tells you the size of the pond, not how many fish you’ll catch.
Estimate your click share. In week one, you’re not ranking anywhere near page one organically. Realistically, almost all of your early traffic comes from PPC. A common starting assumption: Amazon launch sales in the first 2–3 weeks are 80–90% ad-driven, dropping to 40–60% ad-driven by week 8 as organic ranking kicks in.
Rough traffic formula:
Daily Traffic = (Target Keyword Search Volume ÷ 30) × Estimated Click Share × Number of Keywords Targeted
This is a starting estimate, not gospel but it beats guessing.
Step 2: Estimate Your Conversion Rate
Your conversion rate is the percentage of visitors who actually buy. It varies wildly by category, so don’t borrow a number from a totally different niche.
Rough benchmarks by category type:
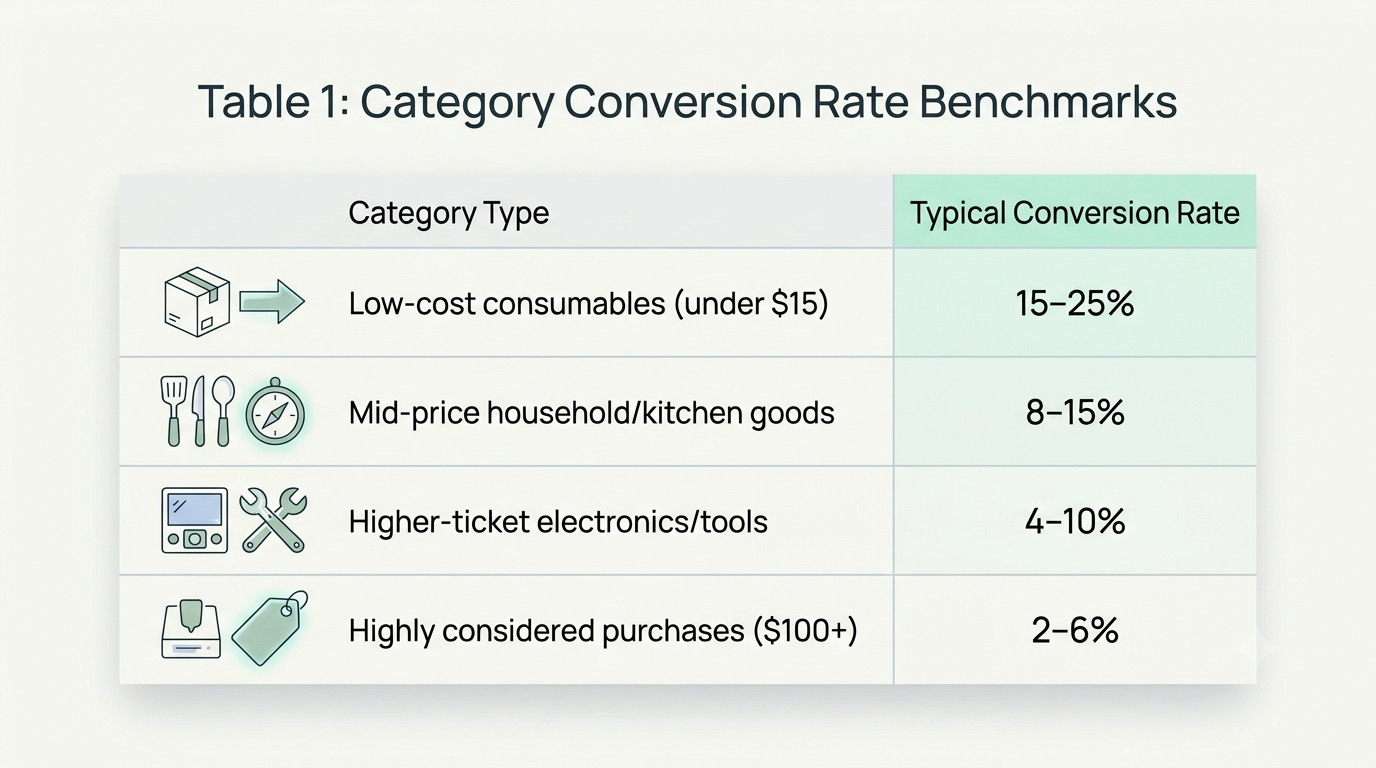
If you’re brand new with zero reviews, discount your category’s typical rate by 30–50% for the first two weeks. No social proof means hesitant buyers, no matter how good your images are.
Step 3: Calculate Your Sales Volume
Once you have traffic and conversion rate, the sales volume math is simple:
Daily Units Sold = Daily Traffic × Conversion Rate
If you’re estimating 200 daily visitors at a 10% conversion rate, that’s 20 units a day roughly 140 a week. Multiply that by your price point, and you’ve got a revenue forecast, not just a unit count.
This is the core of any usable Amazon sales calculator: traffic in, conversion rate applied, units out. Everything else is refinement around this one equation.
Step 4: Calculate Your Ad Budget
This is where most launch plans fall apart not because the math is hard, but because sellers skip it entirely.
Find your break-even ACOS. That’s your profit margin expressed as a percentage. If you have a 35% margin, your break-even Advertising Cost of Sale is roughly 35%. During launch, you’ll likely spend above break-even on purpose that’s the cost of building rank and reviews.
Estimate cost-per-click. Check Amazon’s suggested bid range for your target keywords, or use a PPC research tool for a more accurate range.
Ad budget formula:
Daily Ad Spend = Daily Ad-Driven Clicks × Estimated CPC
If you’re targeting 150 ad clicks a day at an average CPC of $0.80, that’s $120/day, or roughly $3,600 for a 30-day launch window. Compare that to your expected revenue from Step 3 — if the gap is too wide, either your price, budget, or timeline needs adjusting before launch, not after.
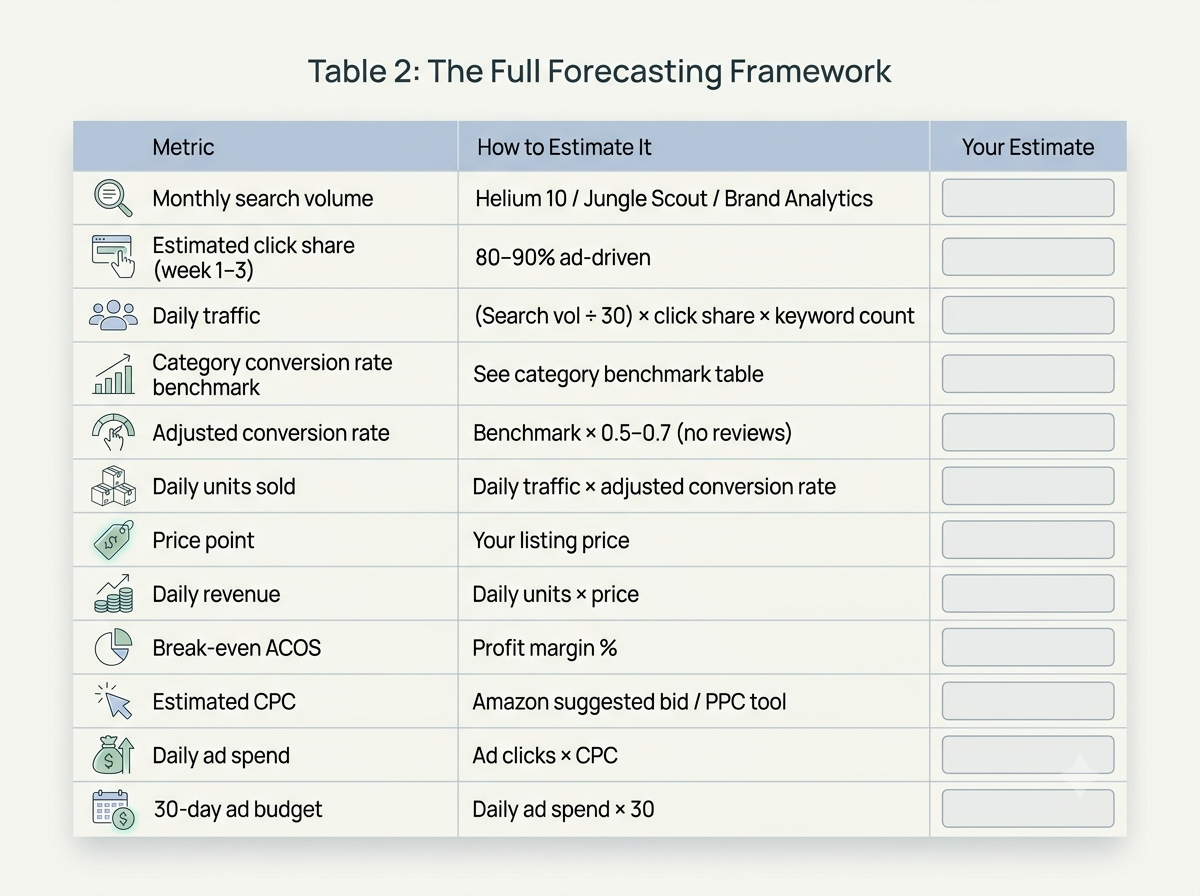
The Full Forecasting Framework
Here’s the whole thing as one downloadable table. Fill in your own numbers in the “Your Estimate” column.This is the same logic behind most Amazon product launch strategy planning — it just puts numbers on what usually stays a gut feeling.
Worked Example
Say you’re launching a $24.99 kitchen tool with a 40% margin.
- Main keyword search volume: 9,000/month
- Estimated click share (launch phase): 85%
- Targeting 3 keyword variations
- Daily traffic: (9,000 ÷ 30) × 0.85 × 1 keyword focus ≈ 255 visitors/day
- Category conversion benchmark: 12%, adjusted down to 7% with zero reviews
- Daily units: 255 × 0.07 ≈ 18 units/day
- Daily revenue: 18 × $24.99 ≈ $450/day
- Estimated CPC: $0.95, targeting 200 ad clicks/day
- Daily ad spend: 200 × $0.95 = $190/day
- 30-day ad budget: ≈ $5,700
That $450/day in early revenue against $190/day in ad spend still leaves real margin but it also shows exactly why launch-phase ACOS runs high on purpose. You’re buying rank, not just sales.
How Amazon Ranking Ties Back Into Sales Volume
Here’s the part forecasts often miss: Amazon ranking sales and organic visibility feed each other in a loop. More sales velocity nudges your organic rank up. A better rank pulls in more free traffic. More free traffic reduces your dependence on ads. That’s the whole point of the launch spend it’s not meant to run forever, it’s meant to kick-start that loop.
If your forecast shows the loop isn’t starting after 3–4 weeks (ad-driven sales stay flat, organic rank doesn’t move), that’s the signal to revisit keywords, prices, or the listing itself not just push more ad spend at the same setup.
FAQs
Framework
It won’t be exact nothing is until real data comes in. But a projection based on the search volume, category benchmarks for conversions, and real CPC numbers will be much more accurate, and will allow you to measure against a benchmark when sales start.
That depends a lot on your category and price point, but the majority of launches range anywhere from $2,000–$8,000 over a period of 30 days. This model will help you pick a number that fits your product, instead of using someone else’s budget.
Often, yes — at least on paper, through a higher-than-normal ACOS. The goal during launch isn’t profit on day one, it’s sales velocity and review count that lower your ad dependence over time.
Weekly for the first month. Compare actual traffic, conversion rate, and spend against your original estimate, and adjust bids or budget based on what’s actually happening, not what you predicted.